

The One Tool You Need to Spot the Best Time to Buy Gold
A tool that investors often rely on to find the best time to buy and sell gold and stocks at any given point in time is the ‘Dow to gold ratio’.
When you enter the world of investing in gold, it can feel like everyone else has a crystal ball that helps them predict the price of gold and pick the perfect time to buy gold.
Of course, this just a matter of perception, however there is a tool that could help you make a well-informed decision. It is called the Dow to gold ratio.
This tool has been used by investors for a number of years now and has likely helped many of them avoid some of the biggest and most damaging stock market crashes in history, pushing them towards the safe haven that is physical gold.
Let’s take a look at how the Dow to gold ratio works and how it can help us understand when to invest in gold.
What is the Dow to gold ratio?
Simply put, it is a tool that tracks the Dow Jones value in terms of the gold prices.
The Dow Jones (or Dow Jones Industrial Average) is an index that tracks the stock price of the 30 largest U.S. companies, including Apple, McDonald’s, IBM, Coca-Cola, etc…
The stocks of the Dow Jones include all the major sectors of the U.S. economy, excluding the transportation and utility industries.
The Dow to gold ratio gives clear indication on how many ounces of gold you need to buy the Dow Jones at its current price (this will be the amount you see when you search for this ratio in Google).
In short:
- When the ratio is high, stocks are expensive, and gold is undervalued.
- When the ratio is low, stocks are undervalued, and gold is expensive.
Essentially, the more the ratio increases, the more it tells us to sell stocks and purchase gold.
And the more it decreases, the more it tells us to sell gold and purchase stocks.
Plenty of well-known investors rely on the Dow to gold ratio, using it as an integral part of their investment strategies. Over the years it has gained its reliable reputation by being used by investors like Bill Bonner, the founder of Agora Financial, and Olav Dirkmaat who is a precious metals analyst.
How do you use the Dow to gold ratio?
Investors in both gold and Dow assets use the ratio to see when it is a good time to buy or sell and to provide them with information on the direction of either market comparative to the other.
This ratio has been used by investors for over 100 years and is viewed as a useful guiding strategy for investment rather than a strict rule.
Showing how the ratio is used in practice can help new investors understand how to benefit from this tool in the best way.
Let us look at what Bill Bonner does with it, a widely quoted investor when it comes to the ratio.
- Bonner focuses on two numbers, 5 and 15, as his reference points:
- When the ratio goes above 15, he will sell stocks and buy gold.
- When the ratio goes below 5, he will sell gold and buy stocks.
- In simple terms:
- If the ratio goes above 15: it takes 15 ounces of gold to buy the Dow. Gold is considered undervalued (cheap) compared to the Dow Jones Index.
- If the ratio falls below 5: this means that it takes just 5 ounces of gold to buy the Dow. Stocks are undervalued compared to gold.
It is also useful to look at how it has worked through history.
How has the Dow to gold ratio worked in history?
The Dow to gold ratio has experienced decades-long trends only diverted when faced by drastic macroeconomic changes.
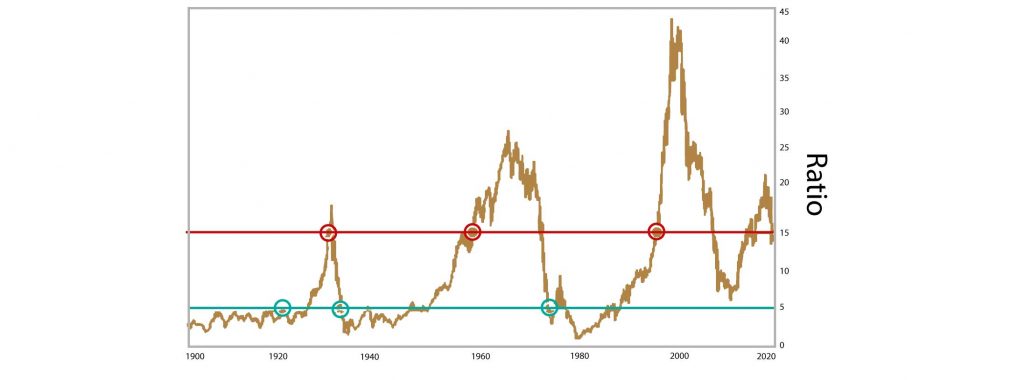
The historical Dow jones to gold ratio chart below perfectly reflects these trends:
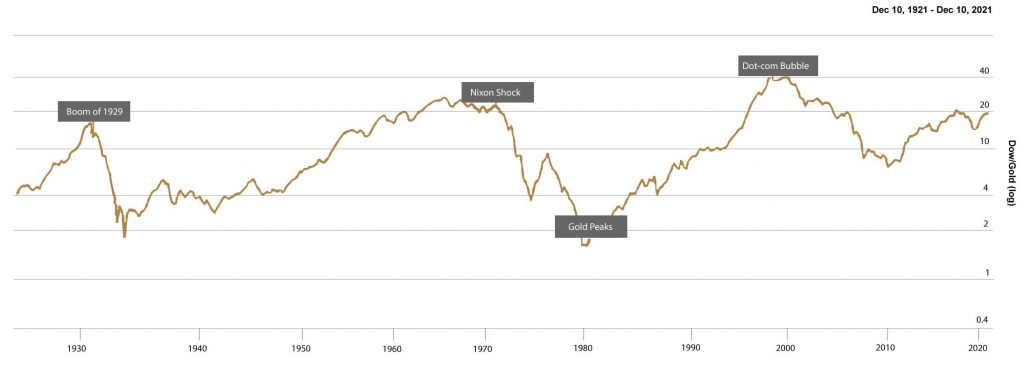
Following the strategy, the red dots indicate the periods when gold should be bought and when you should sell stocks, while the green dots indicate when you should sell gold and buy stocks.
The chart shows the Dow to Gold Ratio from 1900 – 2020, allowing us to see that from July 1996 to December 2020, the Dow to gold ratio went above 15, confirming that gold was undervalued compared to stocks. This offered a perfect entry point for those who wanted to buy.
- If you had bought gold and sold stocks during this specific time, it would have had two major benefits:
- Avoiding the blast from the 2000 dot-com crisis and the stock market crash of 2008.
- Getting into gold just before its huge run that lasted from 1999 to 2011. In this period, the gold price went up 425% in 12 years.
The other time the Dow to gold ratio reached above 15 was in 1929 – which was the year of the infamous Wall Street Crash. To this day this remains the worst stock market crisis in US history.
Typically speaking stock market crashes happen quickly, and the effects are usually severe and long-lasting. Particularly impacting investors and their wealth.
Therefore, it makes sense, as to why people use these investment tools, like the Dow to gold ratio – as it aids in preparing for market movements, avoid potential financial losses and generally guides decisions on when the right time is to buy gold.
Where is the Dow to gold ratio today?
Basically, the ratio is going up!
According to the ratio, it seems that there might be a reason to begin investing in gold, if you haven’t already.
The chart shows that in November 2021, the Dow to gold ratio went above 15, climbing to 19.42 at one point.
This is close to what was seen in 1929, making gold highly undervalued, going off of Bonner’s take on the Dow to gold ratio.
Are you planning to follow the ratio and ditch some of your stocks and get yourself some physical gold?
Image Copyright: bashta
+ There are no comments
Add yours